PaloAlto – Monitor Tab – Filter like a pro - Traffic Logs
Hello Team,
So when I started working with PaloAlto I had some issues
with the process of filtering logs.
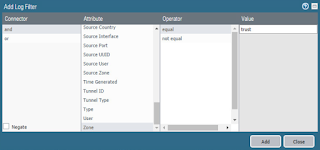
I soon realized that PaloAlto had a query function like
structure. I didn’t use their builder as it was slow and confusing at first. To
this day I don’t us it.
What do I use?
Well, its much fast and simpler. I click on the log file
itself and make it on the fly.
In this example I clicked on the IP “192.168.1.20” and it
automatically populated the filter in the search bar.
From here, we can start adding more filters like traffic denied,
allowed, from what zone, etc.
What I do:
I click on the allow link and then add a “n” to the beginning
of the filtered word “eg” to make it a “not equal” to function. I also removed
the .src from the word addr.src / addr.dst.
This will allow you to view the traffic from both
directions. This is handy when you are trying to see all traffic from that IP as
a source and destination flow.
Once you enable user-id on the interface, you can filter by
users 😉
You can also resolve the host name by clicking on the “Resolve
host name”. Use it to find out what the ip resolved to like google-public-dns.a.google.com. I learned that exporting to Excel is not as useful as you imagine, it does not keep the "resolved" host name and becomes a large file.
Simple post, but that its folks.
Thank you,
AzNetAdmin


